Know your Leica controls, The Acquisition Panel, part II- the center
Setting up your detection windows in the SP8 software
Most of the central portion of the acquisition panel is devoted to the control of the lasers that help generate the photons and the detectors that collect them. Our SP8 has 3 photo-multiplier tubes (PMTs) and 2 Hybrid (HyD) detectors. This is a diagram of their arrangement in the hardware of the system:
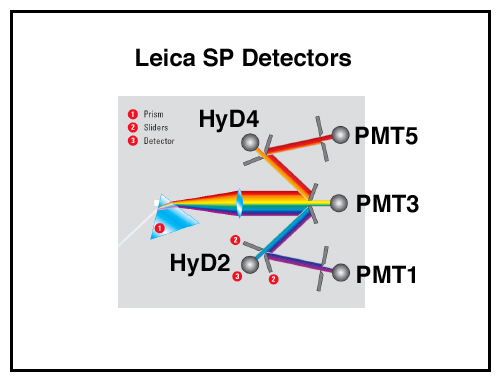
The collected light is sent to PMT3 first. The position of the sliders (2) is adjusted from the acquisition panel. They allow light of the specified wavelength range into the detector, and reflect the blocked wavelengths to the next two detectors (HyD2 & 4). Those sliders will admit selected wavelengths and reflect the remainder to the last two detectors (PMT1 & 5). This is why if you are using only 1 fluorescent detector, and you do not required the extra-sensitivity of the HyD, you should use PMT3, because it can directly “see” all the wavelengths.
This is the central region of the Leica acquisition panel.
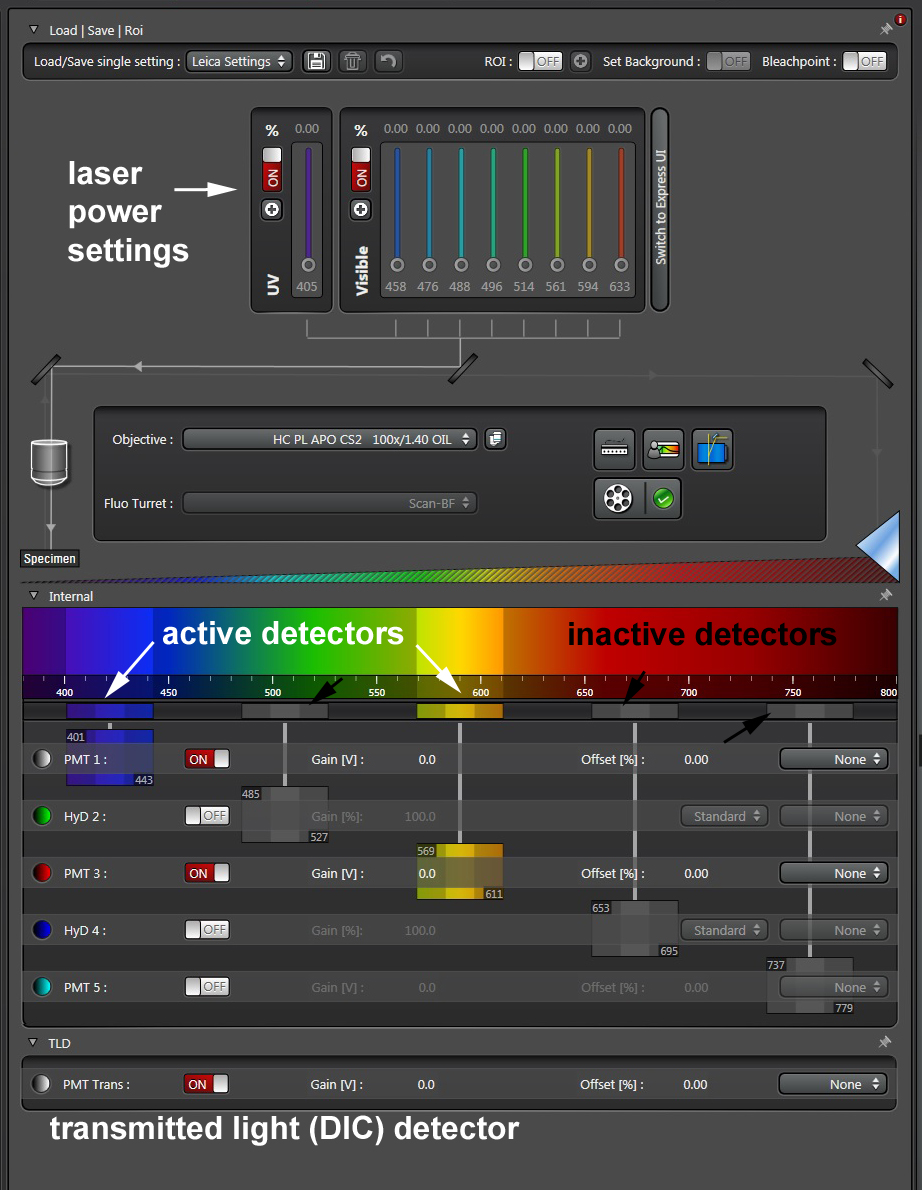
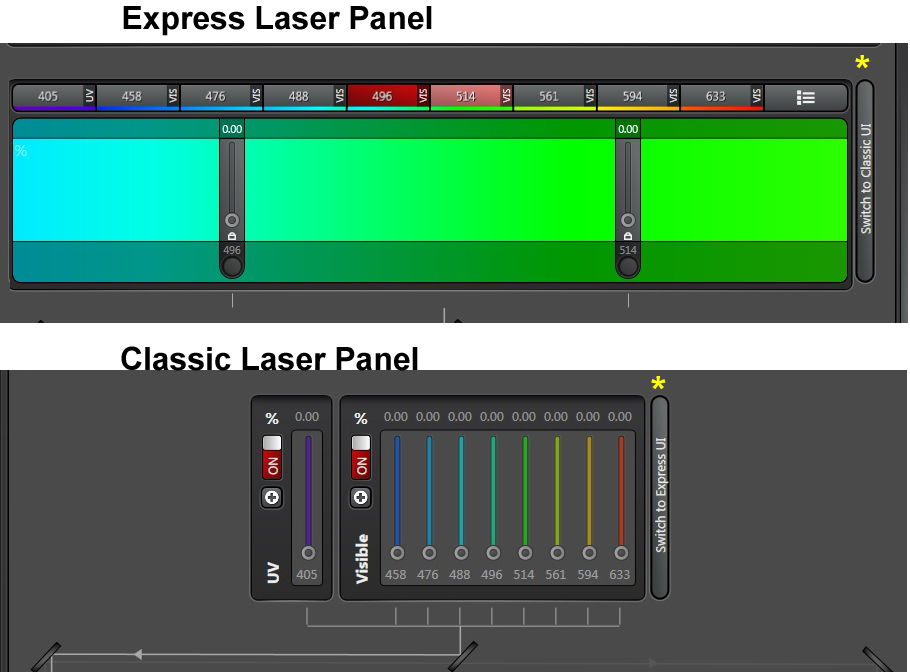
The top portion is used to control the laser intensity. There are on switches for both the UV and visible light lasers, and slider bars for adjusting the power of each laser line. If a laser has not been turned on via the laser configuration panel, the bars will be greyed and cannot be adjusted. You can click and drag, use the scroll wheel on the mouse, or click on the number above a bar and type in the desired value.
There are two versions of the laser panel, and you can switch between them using the button on the right (*):
The lower region diagrams the visible spectrum at the top; controls for the 5 fluorescence detectors and a transmitted light PMT are underneath. The controls for each on these detectors are arranged within the horizontal grey bars.

1 is the button that allows you to select the channel color. 2 is the On-Off switch for the detector. 3 controls Gain (power to the detector), 4 controls Offset, and 5 is a drop down menu that allows you to display emission-excitation spectra on the visible spectrum diagram. The yellow arrow indicates the detection window settings, which control the wavelengths of light allowed into the detector. When the detector is active, this window diagram will be colored to reflect the portion of the spectrum it is set to detect. If the detector is off it will be grey.
When a laser is active and ready to use, a corresponding line will appear on the spectrum diagram:
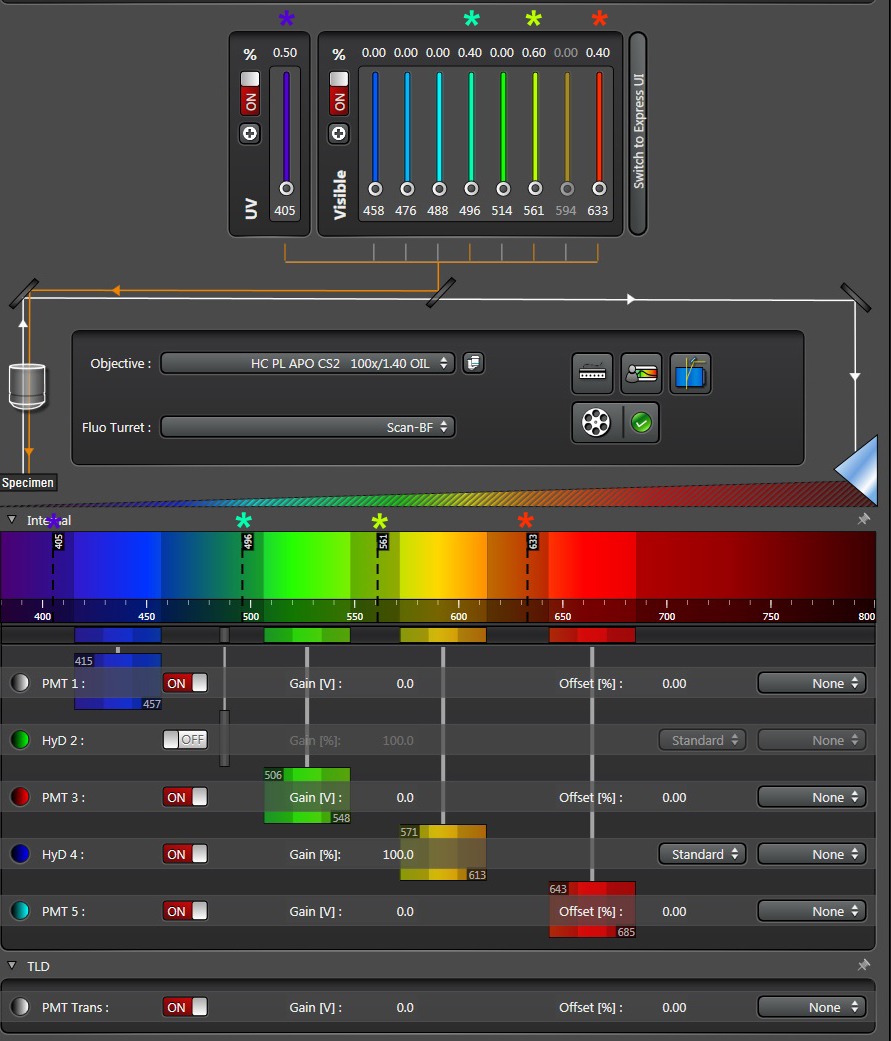
The software also allows a user to display the emission and/or excitation curves for the fluors detected. They are not required to scan, but are very helpful for optimal setting of the slider bars. Click on the top drop down menu of a detection window and select your fluor:
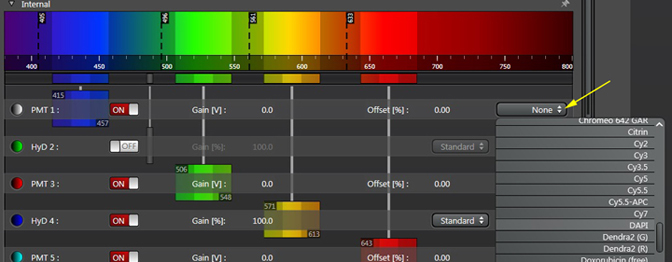
If your dye is not listed, choose the closest match. You can do a lambda scan of any unlisted dye and add it to the drop down menu. When a dye is selected, an emission curve (solid line) will appear:

To see the excitation curve, right click on the spectra display to get this new window. Clicking on “Show Excitation Graph” adds a dotted line excitation curve:
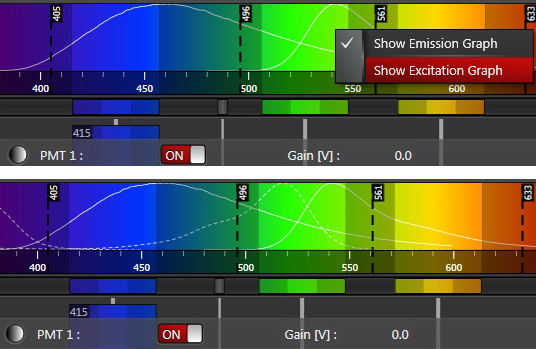
You can right click again to remove either curve if you wish.
The laser lines and emission curves are good guides for setting the spans of the emission windows. With 5 bars things can get confusing, so look for the grey lines that link the windows to the control bars for each detector to keep track of which one your are adjusting.
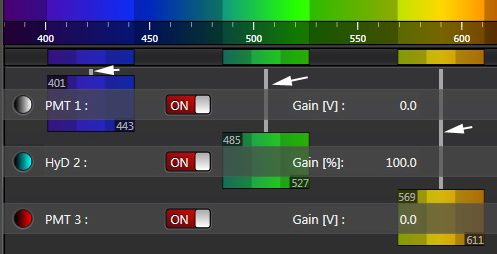
Note that the bars cannot be moved past each other (a reflection of the physical arrangement of the detectors and sliders), so if you are simultaneously scanning with one than one laser and using multiple detectors, you need to use the windows on the left/center for the shorter wavelengths, and the center/right windows for collecting longer wavelength light.
Inactive grey bars should be minimized to allow maximum space for the active detectors bars. To minimize a bar, left click it with the mouse and drag to shrink it.
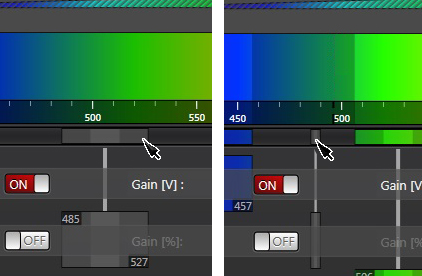
To set the wavelength range for an active detector, you can click on a bar and move it from side to side to position it, and you can click and drag to expand it. Another option is to double left-click on a bar to bring up a wavelength setting window, and type in the numbers:
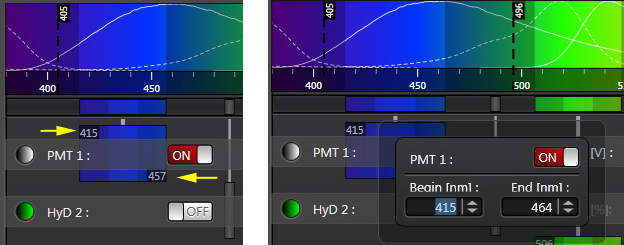
The lower end of the range should never be less that 10nm higher than the wavelength of the laser line (in this example the “Begin” setting should be set to 415 nm for the 405 laser). This will avoid any problems with unwanted reflection of the collected light.
Remember “laser + 10” for setting your left side limits on the detectors.
The control bars for each detector also allow you to adjust the Gain and offset for the detector. When you hover the mouse arrow over one, a slider will appear. You can also turn the knobs on the USB panel under the computer screen.
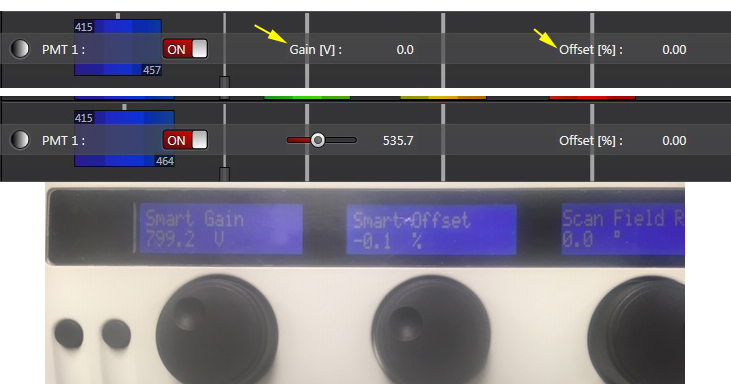
Increasing the gain boosts the power, so your signal will get stronger, but so will your background. The offset is used to set the floor threshold, i.e., define the zero or totally black pixel (which will appear green in the LUT window Hi-Lo view). The proper adjustment of these settings is covered in the next section about the right side of the acquisition panel.
To change the assigned channel color, double click the dot (1) next to the detector name, which opens this panel:
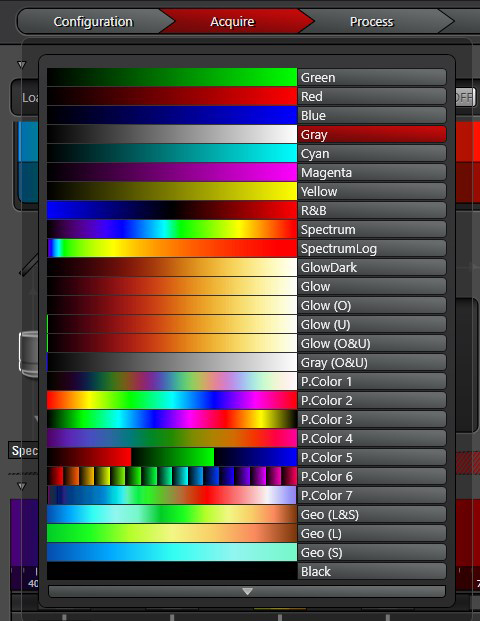
The Rest of the Center Panel
A few features in the center of the center panel not related to detection windows that users should know about:
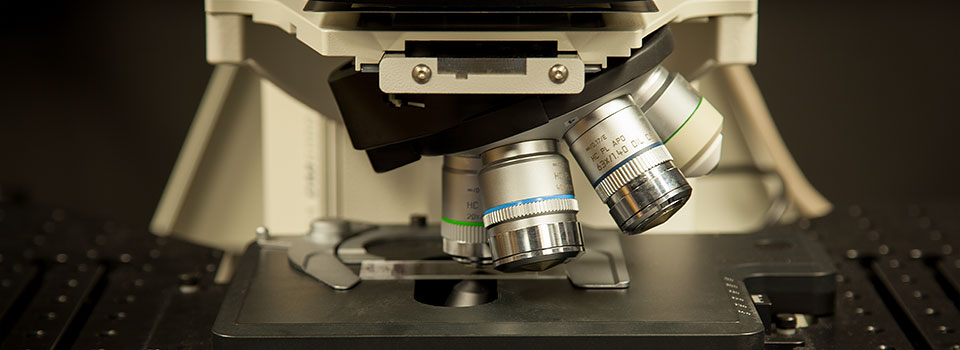
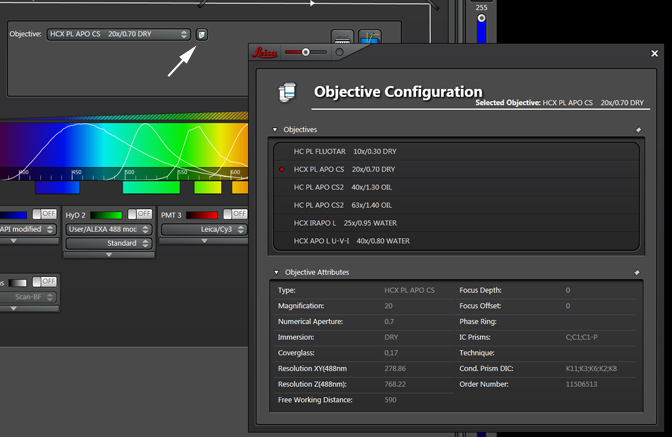
The objective setting. A number of the microscope’s functions, such as defining the working distances for autofocus or calculating the optimal thickness of an optical slice, take the objective’s specifications into account. Therefore it is always a very good idea to make sure that the objective listed in the software actually matches the one that you are using. If they don’t match, the objective is in the wrong place on the turret and should be moved to the correct position. Only 6 objectives can be listed in the software/mounted on the turret at any given time, but if you need to use a different one, the Core manager can adjust the settings.
This is the objective drop down menu. It lists the objectives in the order of their turret positions (1 at the top to 6 at the bottom), with the objective currently in the home position (i.e., over the sample) highlighted in red.

Clicking on the objective icon to the right will open a window that provides detailed information about the objectives currently mounted:
A second button of interest to most users, the USB control panel settings:
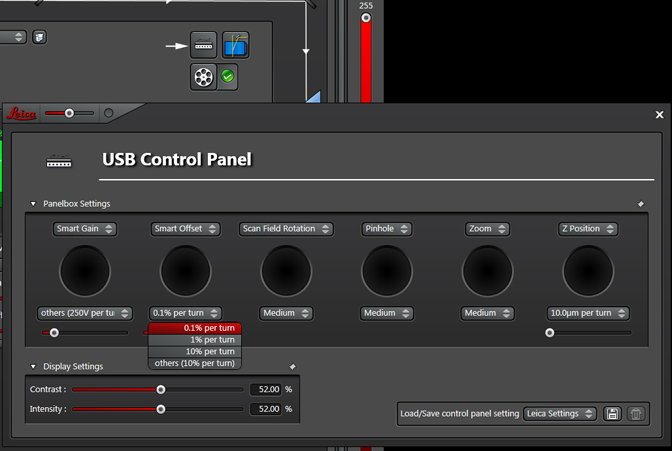
The drop-down menus underneath each knob icon allow you to adjust the sensitivity of that knob to your personal preferences. You can change the functions controlled by a knob using the drop-down menu above its icon.
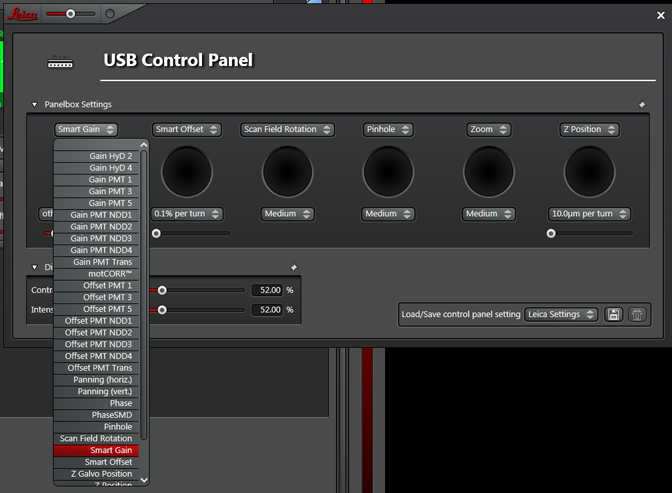
Most people will use the Leica default settings for knob assignments (Smart Gain/ Smart Offset/ Scan Field Rotation/ Pinhole/ Zoom/ Z-Position). If you need a different combination for your imaging, you should save your personalized settings (bottom right of the panel) for future use.
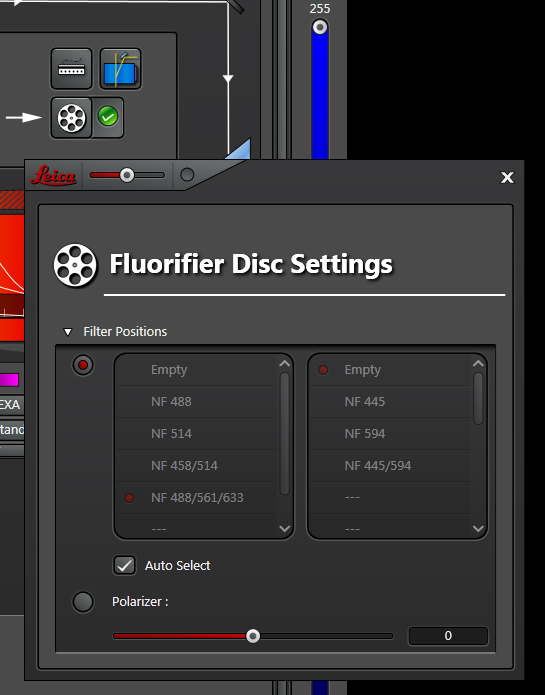
The other buttons in the center of the center panel will likely never be needed by almost all users, but for the edification of the curious:
The Acoustical Beam Splitter panel button
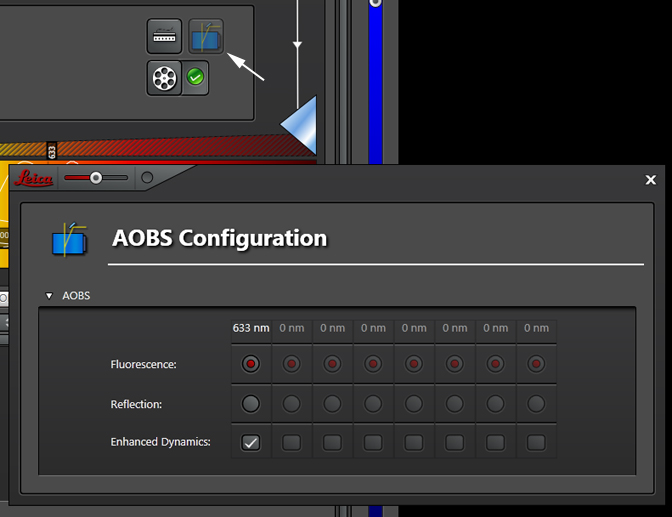
The Fluorifier Disc Setting window:
